The hot tub market spans portable “plug-and-play” spas, fixed/installed hot tubs, and related residential and commercial demand (hotels, resorts, rentals, wellness facilities).
hot tub market statistics
Below are current market size estimates, growth projections, and mix indicators (product type, channels, regional signals), compiled from recent industry research and U.S. government/standards-adjacent documentation.
Key Hot Tub Market Statistics
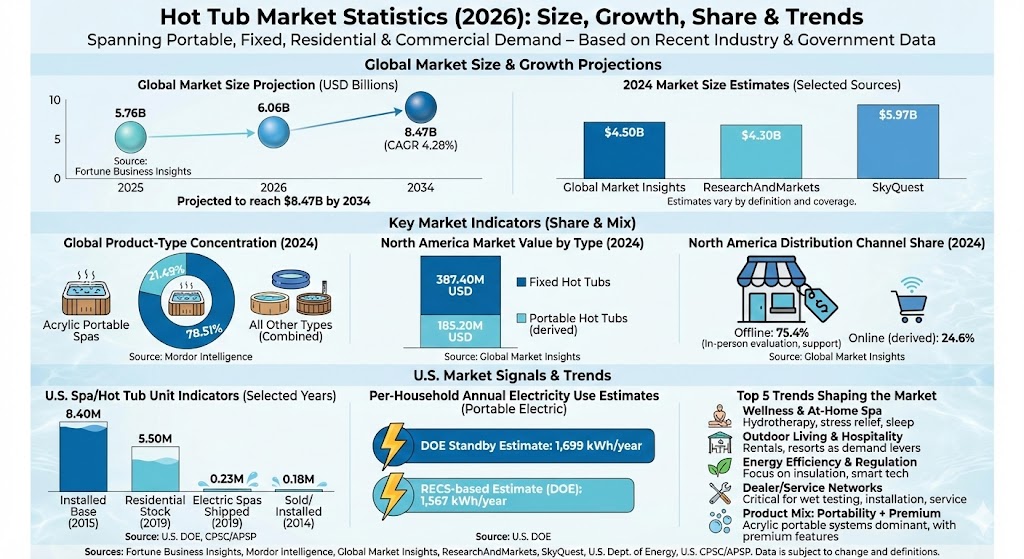
Global market size (2025): $5.76B, projected to reach $8.47B by 2034 (CAGR 4.28%). (Fortune Business Insights, Jan 2026)
Alternate global estimate (2025): $5.12B, reaching $6.21B by 2030 (CAGR 3.94%). (Mordor Intelligence)
Global market (2024–2032): $4.5B in 2024, forecast $6.4B by 2032 (≈4% CAGR). (Global Market Insights)
Global market (2024–2030): $4.3B in 2024, projected $5.3B by 2030 (CAGR 3.3%). (ResearchAndMarkets / Market Glass, Feb 2026 listing)
North America share: 41.84% of the global market in 2025. (Fortune Business Insights)
Product mix signal: Acrylic portable spas held 78.51% share in 2024. (Mordor Intelligence)
North America (regional report): $572.6M in 2024; fixed hot tubs $387.4M in 2024; offline channel 75.4% share in 2024. (Global Market Insights)
U.S. installed base signals: 8.4M spas installed base in 2015; ~5.5M residential hot tubs stock in 2019 (≈95% electric); ~230,000 electric spas shipped in 2019. (U.S. DOE)
U.S. annual installs (historical): 184,029 hot tubs sold/installed in 2014 (APSP-reported figure cited by CPSC). (U.S. CPSC document citing APSP)
Operating cost proxy: DOE estimated ~1,699 kWh/year (standby energy) for portable electric spas; another estimate cited 1,567 kWh/year per household. (U.S. DOE)
Market Size and Growth
Hot tub market sizing varies by definition (portable vs. fixed inclusion), geography coverage, and whether the source includes adjacent spa categories. The charts below show a projection path from one provider and a side-by-side snapshot of 2024 market size estimates from multiple publishers.
Global hot tub market projection (Fortune Business Insights)
Year
Bar
Value (USD B)
2025
5.76
2026
6.06
2034
8.47
Max = 8.47. Widths: 2025 68.00%, 2026 71.55%, 2034 100.00%.
Global hot tub market size estimates (2024, selected sources)
Source
Bar
Value (USD B)
Global Market Insights
4.50
ResearchAndMarkets (Market Glass listing)
4.30
SkyQuest
5.97
Max = 5.97. Widths: Global Market Insights 75.38%, ResearchAndMarkets (Market Glass listing) 72.03%, SkyQuest 100.00%.
Product and Channel Mix
Across sources, the market skew is toward portable solutions, with premium acrylic portable spas highlighted as a dominant category. Offline retail remains the primary route for high-ticket purchases in North America, reflecting the importance of in-person evaluation, installation support, and dealer service networks.
Global product-type concentration signal (2024)
Category
Bar
Share
Acrylic portable spas
78.51%
All other types (combined)
21.49%
Max = 78.51%. Widths: Acrylic portable spas 100.00%, All other types (combined) 27.37%.
North America hot tub market value by type (2024)
Type
Bar
Value (USD M)
Fixed hot tubs
387.40
Portable hot tubs (derived)
185.20
Max = 387.40. Widths: Fixed hot tubs 100.00%, Portable hot tubs (derived) 47.81%.
North America distribution channel share (2024)
Channel
Bar
Share
Offline
75.4%
Online (derived)
24.6%
Max = 75.4%. Widths: Offline 100.00%, Online (derived) 32.63%.
U.S. Installed Base, Shipments, and Usage Proxies
For a grounded “real-world” demand signal, U.S. DOE documentation cites installed base and shipment estimates for portable electric spas, and a separate U.S. CPSC document (in a standards context) cites APSP-reported installation counts. These are not global market revenue figures, but they provide useful scale indicators for unit volumes and operational footprint.
U.S. spa/hot tub unit indicators (selected years)
Metric
Bar
Value (M units)
Installed base of spas (2015)
8.40
Residential hot tubs stock (2019)
5.50
Electric spas shipped (2019)
0.23
Hot tubs sold/installed (2014)
0.18
Max = 8.40. Widths: Installed base of spas (2015) 100.00%, Residential hot tubs stock (2019) 65.48%, Electric spas shipped (2019) 2.74%, Hot tubs sold/installed (2014) 2.19%.
Per-household annual electricity use estimates (portable electric spas)
Estimate
Bar
Value (kWh/year)
DOE standby estimate
1,699
RECS-based estimate cited by DOE
1,567
Max = 1,699. Widths: DOE standby estimate 100.00%, RECS-based estimate cited by DOE 92.23%.
Trends Shaping the Hot Tub Market
Wellness and at-home spa demand: Hydrotherapy, stress relief, recovery, and sleep positioning continues to broaden demand beyond “luxury-only” buyers.
Outdoor living and hospitality pull-through: Rentals and hospitality properties use hot tubs as a conversion and nightly-rate lever; this supports commercial installations and replacement cycles.
Energy efficiency and regulation tailwinds: DOE energy-use work on portable electric spas highlights large electricity consumption at the household level, increasing focus on insulation, smart scheduling, and efficiency tech.
Dealer/service networks remain critical: North America’s high offline share aligns with the need for wet testing, delivery/installation coordination, and ongoing water-care service.
Product mix: portability + premium acrylic: Research summaries highlight portable systems as a dominant revenue driver; premium features (jets, lighting, filtration) remain key differentiators.
Sources
Fortune Business Insights (Jan 2026). “Hot Tub Market” (2025 value, 2026–2034 forecast, and regional share notes).
Mordor Intelligence. “Hot Tub Market” (2025–2030 sizing and 2024 acrylic portable share).
Global Market Insights. “Hot Tub Market” (2023–2032 sizing; regional notes) and “North America Hot Tub Market” (2024 size, type value, and channel share).
ResearchAndMarkets (Feb 2026 listing). “Hot Tubs – Global Strategic Business Report” (2024 value and 2030 projection).
SkyQuest (Published June 2025). “Hot Tub Market Size, Share, and Growth Analysis” (2024 value and 2025–2033 projections).
U.S. Department of Energy (Aug 2022). “Final Determination of Portable Electric Spas as a Covered Consumer Product” (installed base, shipments, and energy use estimates).
U.S. Consumer Product Safety Commission (Draft document citing APSP 2015 report). APSP-reported 2014 hot tub installs figure and installed-base context.