Hot tubs sit at the intersection of home-improvement spending, wellness trends, and ongoing operating costs. Below is a data-first snapshot of the hot tub market (size + segment shares), plus evidence-based safety and water-quality thresholds from public health agencies.
hot tub statistics
Hot tub market: headline statistics
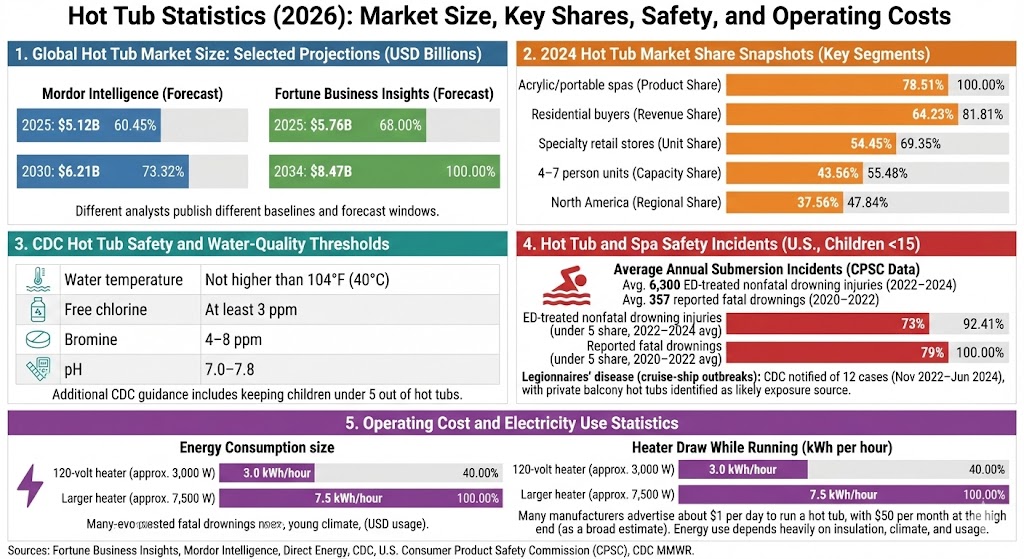
Global hot tub market size (2025): USD 5.76B; projected to reach USD 8.47B by 2034. [1]
Alternative forecast (2025 → 2030): USD 5.12B in 2025, projected to reach USD 6.21B by 2030. [2]
Largest 2024 product segment: acrylic/portable spas at 78.51% share. [2]
CDC safety threshold: hot tub water temperature should not exceed 104°F (40°C). [4]
Pool/spa submersion (U.S., children <15): an average of 6,300 ED-treated nonfatal drowning injuries per year (2022–2024) and 357 reported fatal drownings per year (2020–2022). [5]
Legionnaires’ disease (cruise-ship outbreaks): CDC was notified of 12 cases among travelers on two cruise ships (Nov 2022–Jun 2024), with private balcony hot tubs identified as the most likely exposure source. [6]
2024 hot tub market share snapshots
These figures highlight where demand and revenue concentrate across product type, end-user, capacity, and geography.
Label
Bar
Value
Acrylic/portable spas (product share)
78.51%
Residential buyers (revenue share)
64.23%
Specialty retail stores (unit share)
54.45%
4–7 person units (capacity share)
43.56%
North America (regional share)
37.56%
Max = 78.51%. Widths: Acrylic/portable spas 100.00%, Residential buyers 81.81%, Specialty retail stores 69.35%, 4–7 person units 55.48%, North America 47.84%.
Global hot tub market size: selected projections
Different analysts publish different baselines and forecast windows. The chart below places two commonly cited forecast sets side by side.
Label
Bar
Value
Mordor (2025)
$5.12B
Fortune BI (2025)
$5.76B
Mordor (2030)
$6.21B
Fortune BI (2034)
$8.47B
Max = $8.47B. Widths: Mordor (2025) 60.45%, Fortune BI (2025) 68.00%, Mordor (2030) 73.32%, Fortune BI (2034) 100.00%.
Operating cost and electricity use statistics
Energy use depends heavily on insulation quality, climate, set temperature, and how often the heater cycles. One consumer-energy guide notes many manufacturers advertise about $1 per day to run a hot tub, with $50 per month at the high end (as a broad estimate). [3]
Heater draw while running (kWh per hour)
For a simple “while-in-use” estimate, the same guide suggests a hot tub with a 120-volt heater may consume about 3 kWh while in use, versus about 7.5 kWh for a larger heater. [3]
The CDC provides straightforward thresholds for safer hot tub use—especially important for preventing overheating and reducing the risk of waterborne illness. [4]
Metric
CDC guidance
Water temperature
Not higher than 104°F (40°C)
Free chlorine
At least 3 ppm
Bromine
4–8 ppm
pH
7.0–7.8
Additional CDC guidance includes keeping children under 5 out of hot tubs. [4]
Hot tub and spa safety incidents (U.S.): key proportions
In its annual pool-or-spa submersion report, the U.S. Consumer Product Safety Commission (CPSC) reports an average of 6,300 ED-treated nonfatal drowning injuries per year (2022–2024) and 357 reported fatal drownings per year (2020–2022) involving children younger than 15 years. [5]
Children under 5 account for the majority of incidents
The same report states that, on average, 73% of ED-treated nonfatal drowning injuries (2022–2024) and 79% of reported fatal drownings (2020–2022) involved children younger than 5 years. [5]
In an MMWR investigation, the CDC reports that during November 2022–June 2024, it was notified of 12 Legionnaires’ disease cases among travelers on two cruise ships (8 on one ship and 4 on the other). Investigators identified private balcony hot tubs as the most likely exposure source. [6]
The report also describes environmental testing where Legionella was detected in private balcony hot tubs and emphasizes that inadequate operation and maintenance can create favorable conditions for Legionella growth and transmission. [6]
Sources
[1] Fortune Business Insights — Hot Tub Market (global market size 2025, 2026, 2034): https://www.fortunebusinessinsights.com/hot-tub-market-104629
[2] Mordor Intelligence — Hot Tub Market (2024 segment shares; 2025 and 2030 market size): https://www.mordorintelligence.com/industry-reports/hot-tub-market
[3] Direct Energy — Heating a hot tub: monthly expenses and energy usage guide (cost and kWh estimates): https://www.directenergy.com/en/learn/home-energy-management/how-much-electricity-does-a-hot-tub-use
[4] CDC — What You Can Do to Stay Healthy in Hot Tubs (104°F guidance; disinfectant and pH levels; under-5 guidance): https://www.cdc.gov/healthy-swimming/safety/what-you-can-do-to-stay-healthy-in-hot-tubs.html
[5] U.S. Consumer Product Safety Commission — Pool or Spa Submersion: Estimated Nonfatal Drowning Injuries and Reported Drownings, 2025 Report (May 2025): https://www.cpsc.gov/s3fs-public/Pool-or-Spa-Submersion-Estimated-Nonfatal-Drowning-Injuries-and-Reported-Drownings-2025-Report.pdf
[6] CDC MMWR — Two Outbreaks of Legionnaires Disease Associated with Outdoor Hot Tubs for Private Use — Two Cruise Ships, November 2022–July 2024: https://www.cdc.gov/mmwr/volumes/73/wr/mm7342a3.htm